
The experience you have in college will depend on a lot of factors. Who you are as a person, the type of student you are, the subject you’re studying, and where you go to school will all influence what your college experience is like.
And while it’s true that everyone’s experience in college is different, some colleges and universities facilitate a better experience for their students both on campus and online.
Featured Programs
In years past, online learning was frowned upon as a “lesser” form of education. When online education was in its infancy, this was not far from the truth. The technologies that are relied on today to give online students an immersive experience – interactive video, online collaboration software, and on-demand video, to name a few – didn’t exist. If you took an online class in the 2000s, you likely had a pretty lonely and unstimulating learning experience.
But things have changed.
Many of today’s online learning options can be described as innovative, flexible, forward-thinking, and robust. Educational institutions have spent millions and millions of dollars investing in online learning so that students like you can get the same quality of education while learning remotely as the students who learn in on-campus classrooms.
In fact, where online learning was perhaps frowned upon a couple of decades ago, today it is the preferred method of getting an education for millions and millions of students.
But, just like every person’s college experience is different, every educational institution has a different level of online learning. Some colleges and universities have an incredible and varied array of online learning options with all the tools and resources you could hope for to help you advance your learning. Other schools, though, have fewer online learning resources, and as such, their online programs might not be as preferable.
Our goal is to help you sift through the many different online learning options so you can find the online degree program that best fits your needs. So, how do we do that?
Our Methodology
The basis of our methodology is in hard numbers and statistics that are readily available to the public.
In basing our rankings on data from sources like the National Center for Education Statistics and the U.S. Department of Education (among others), we are able to zero in on valuable details that will help you determine the quality of a program and whether it fits in with your educational goals or not.
Our methodology is a system in which we can evaluate a college or university’s merit on seven key metrics, which are discussed below.
Some of these metrics evaluate program-specific information – details that apply to the specific degree program that you’re interested in learning more about. Other metrics evaluate the college or university itself. Together, this gives you a look at micro-level and macro-level information that will help you decide what direction is best for your education
As explained below, the information we gather is translated into a weighted score which is then used to easily rank online programs.
Methodology Criteria
Below is a breakdown of the seven criteria used in our methodology with the weight each criterion carries in the final score in parenthesis.
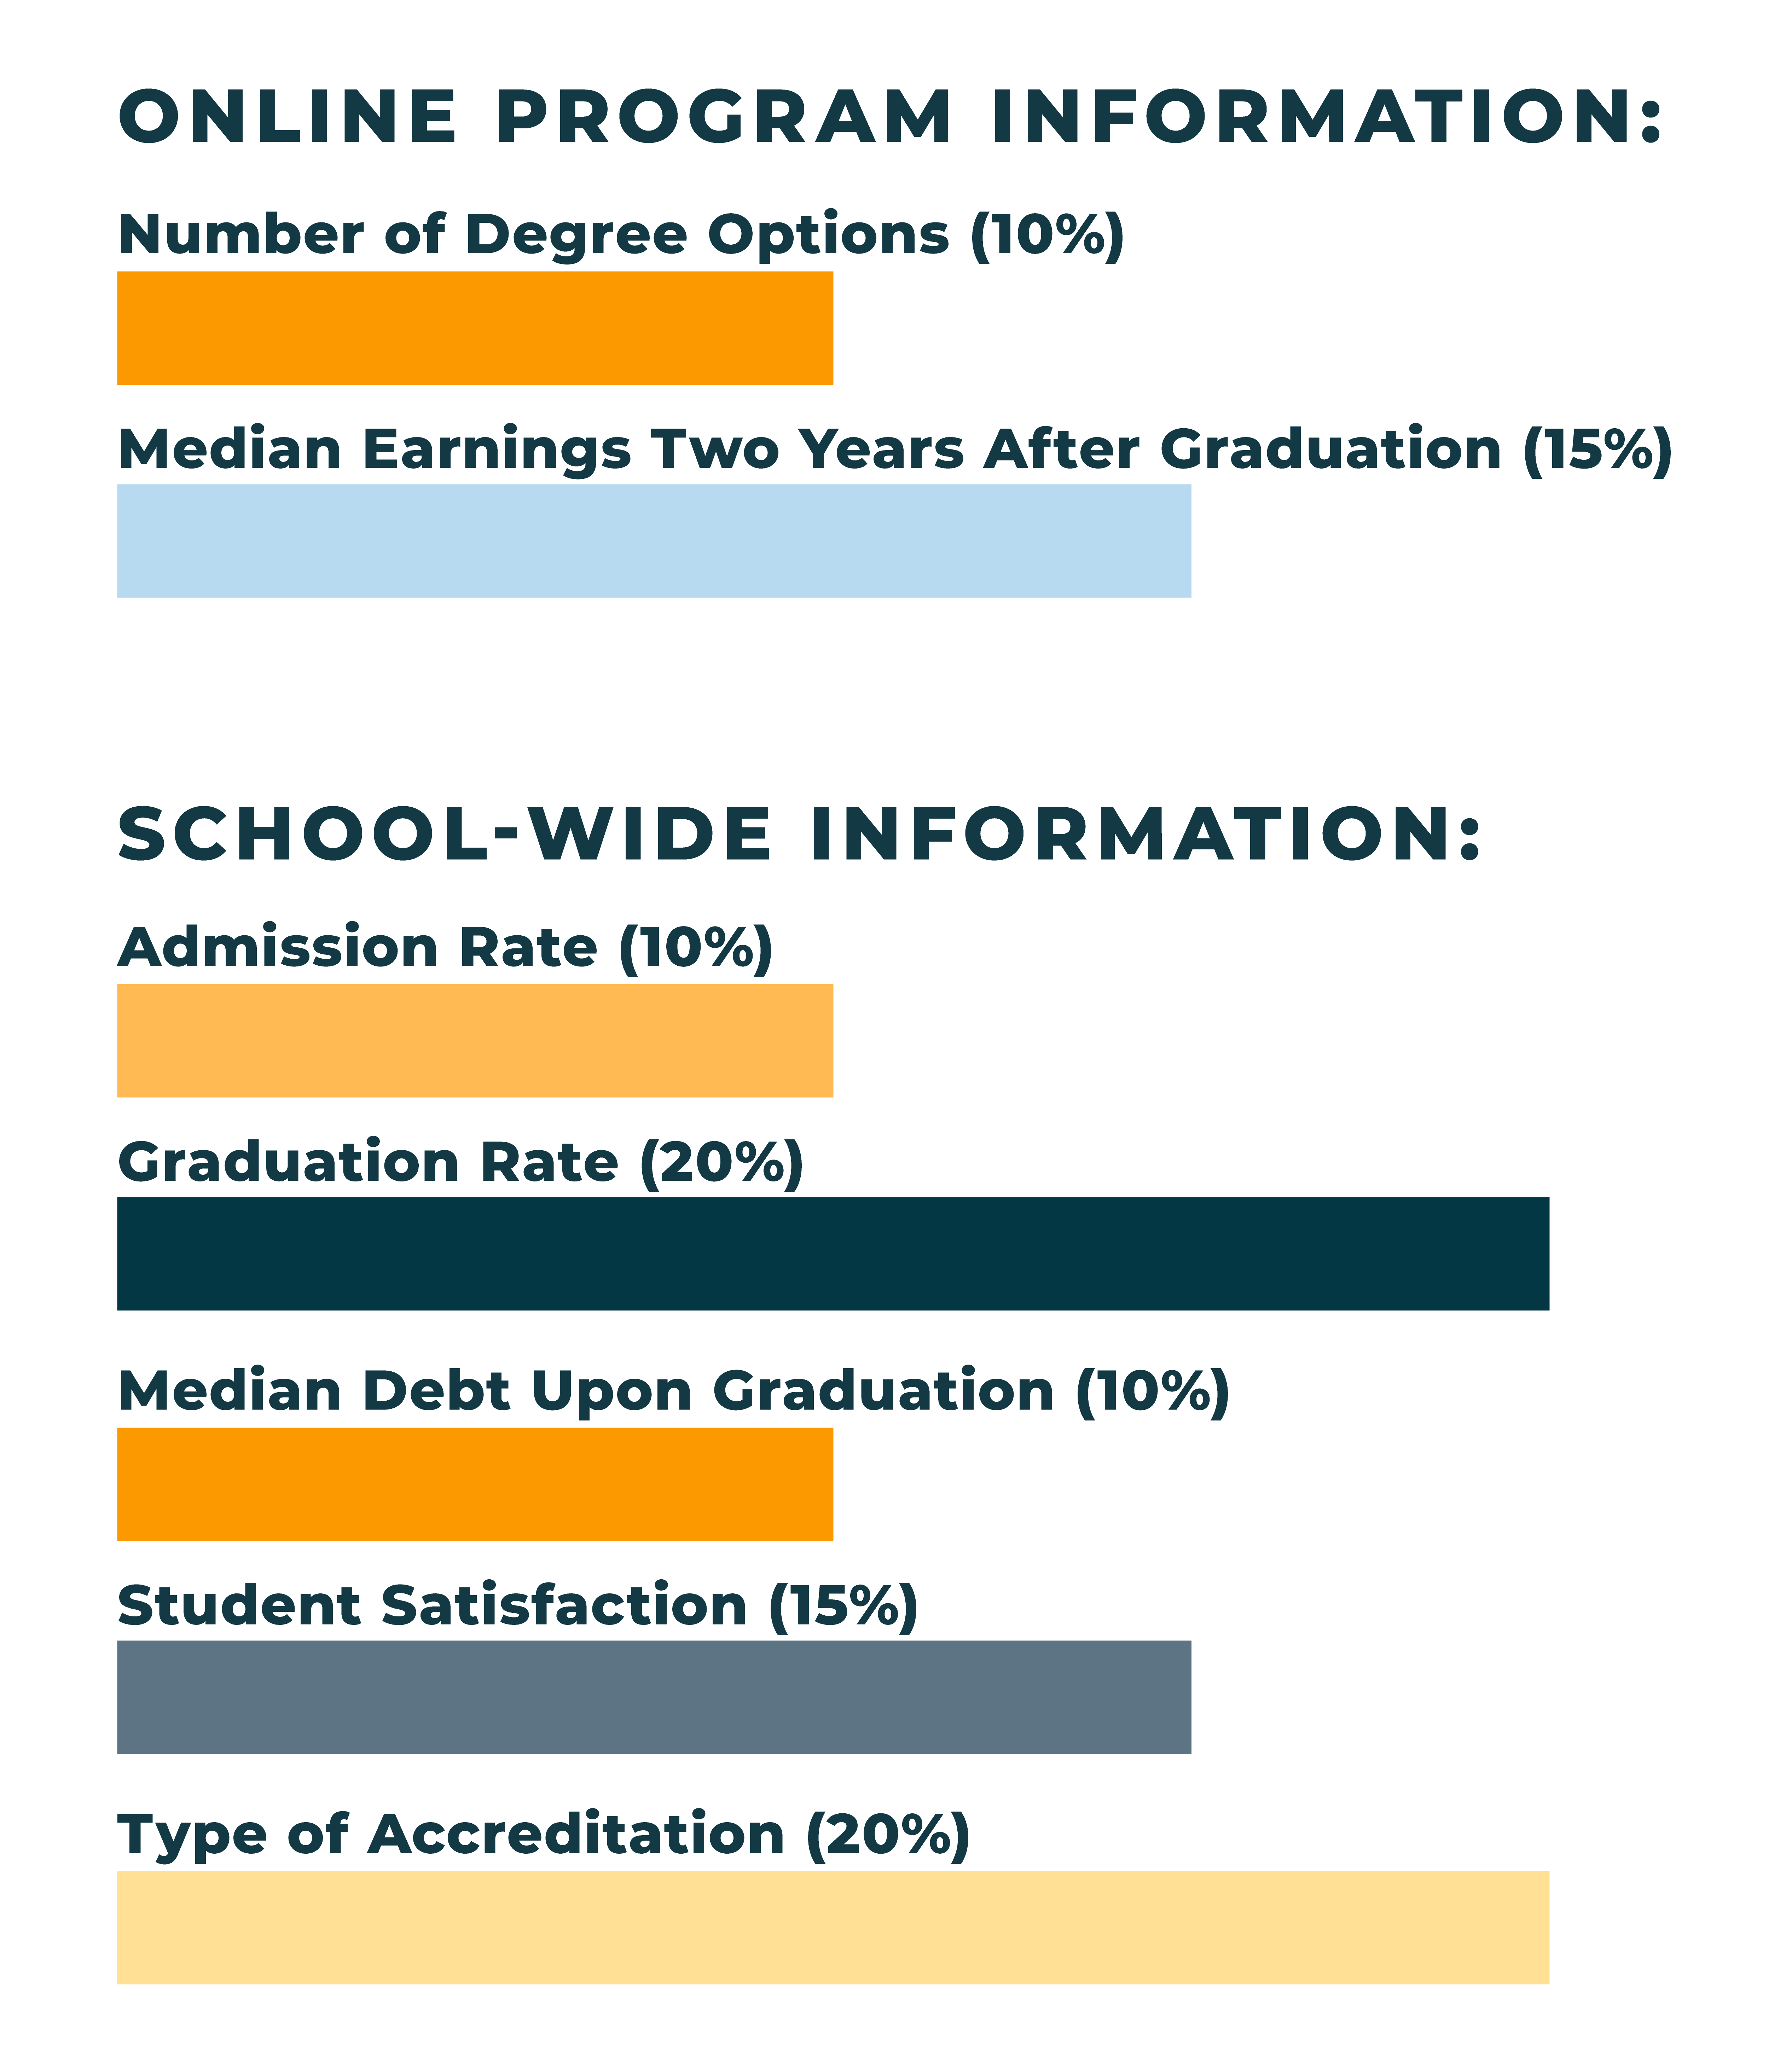
Online Program Information:
- Number of Degree Options (10%)
- Median Earnings Two Years After Graduation (15%)
School-Wide Information:
- Admission Rate (10%)
- Graduation Rate (20%)
- Median Debt Upon Graduation (10%)
- Student Satisfaction (15%)
- Type of Accreditation (20%)
Explanation of Methodology Criteria
Number of Degree Options
The number of online bachelor’s programs offered at the university in that field or the number of online master’s programs offered at the university in that field. This data is retrieved from the individual schools’ websites.
Median Earnings
For graduates with a bachelor’s degree or a master’s degree, the median earnings is the expected salary two years after graduating with their degree. This data is retrieved from the College Scorecard.
Admission Rate
The percentage of students who applied and were accepted to the college or university. Data is retrieved from the National Center for Education Statistics.
Graduation Rate
The percentage of students that completed their degree and graduated within eight calendar years of starting their studies. Data is retrieved from the College Scorecard.
Median Debt Upon Graduation
The total amount of federal debt carried by graduates of a bachelor’s degree program. This measure includes only federal loans that originated at the school from which the degree was conferred. Data is retrieved from the College Scorecard.
Student Satisfaction
Scores are retrieved from RateMyProfessors.com. The score is out of a possible five points.
Type of Accreditation
Schools that are accredited must meet or exceed quality standards as set forth by an accrediting body. Accreditation helps colleges and universities determine whether credits from another college or university are acceptable. Accreditation can be bestowed by regional accrediting bodies or national accrediting bodies. Regional accreditation is preferred, and as such, institutions that have regional accreditation are given two out of a possible two points while nationally-accredited colleges and universities are given one point. The accreditation status of institutions is sourced from the Database of Accredited Postsecondary Institutions and Programs.
Scoring
All schools that offer the degree in question online are considered for inclusion in the rankings. The seven data points above are pulled for all schools on that list and assigned standardized points as follows:
Number of Degree Options
- 3 points: 3+ programs
- 2 points: 2 programs
- 1 point: 1 program
Median Earnings Two Years After Graduation
- 3 points: $56,310 and above
- 2 points: $40,000 and above
- 1 points: $39,999 and below
Admission Rate
- 3 points: 33% and below
- 2 points: 34-66%
- 1 point: 67% or more
Graduation Rate
- 3 points: 80% and above
- 2 points: 60-79%
- 1 point: 59% and below
Median Debt Upon Graduation
- 3 points: less than $25,000
- 2 points: $25,001 to $40,000
- 1 point: more than $40,000
Student Satisfaction
- 3 points: 4 stars or higher
- 2 points: 3-3.99 stars
- 1 point: 2.99 stars and below
Type of Accreditation
- 2 points: Regional accreditation
- 1 point: National accreditation
- 0 points: Not accredited
Note: The high cutoff point for median earnings is based on the median annual wage in the United States, which was $56,310 as of May 2020. The middle cutoff point for admission rate is based on the national average for admission rate, which is 66%. The middle cutoff point for graduation rate is based on the national average as well, which is 60%.
Each data point is then scaled to 100. From there, the weights are added and combined into the OSR score. Again, the weights are as follows:
- Number of Degree Options (10%)
- Median Earnings Two Years After Graduation (15%)
- Admission Rate (10%)
- Graduation Rate (20%)
- Median Debt Upon Graduation (10%)
- Student Satisfaction (15%)
- Type of Accreditation (20%)
Example:
Let’s say that a school has two different online degree options in accounting. Based on our methodology, that school would receive 2 out of 3 points for the Number of Degree Options category. That raw score would be scaled to 100 (2/3 x 100 = 66.67) and then the weight of the category would be applied, in this case, 10% (66.67 x 0.10 = 6.67).
Let’s also assume that a program has a Median Earnings of $60,000, which would garner a raw score of 3 out of 3 points for that category. We would scale that raw score as we did before (3/3 x 100 = 100) and then apply the category weight (100 x 0.15 = 15). The weighted scores would be added to the weighted scores for the other categories to arrive at the final OSR score that’s seen next to each school in the rankings. The numbers displayed for each data point under the school are the actual, unmanipulated data points for each school.
Missing Data
For data points that are not reported or are “Privacy Suppressed,” a penalized number is substituted during scoring.
For the Number of Degree Options, Admission Rate, Graduation Rate, and Student Satisfaction, the average for all schools is found, then 15 percent is subtracted to establish the penalized number for the school with the missing data.
For Median Earnings, data for all programs is used as a substitute if the data for a specific program isn’t reported.
For Median Debt, the penalized number is the result of the average of graduates’ earnings at the university, minus 15 percent.
For Type of Accreditation, the penalized number is zero.
In all instances, when data is missing, the ranking will display “not reported” next to the data point.
Other Rankings on Online Schools Report
“Most Affordable” Rankings
Most Affordable rankings sort schools solely on their Average Net Price, as reported by the National Center for Education Statistics. Average Net Price factors in expected financial aid and fees.
“School-Wide” Rankings
Rankings that don’t focus on a single program, like Best ROI or Best Online Colleges rankings, use different metrics.
Student Satisfaction, Admission Rate, and Number of Degree Options are the same as the program-specific rankings. In addition we use Student-to-Faculty Ratio, Average Financial Aid, and Graduation Rate.
Student-to-Faculty Ratio
The average number of students per one faculty member, as reported by the National Center for Education Statistics.
Average Financial Aid
The average award given to each student, as reported by the National Center for Education Statistics.
Graduation Rate
The percent of full-time undergraduate students who enroll and subsequently graduate within 150% of the “normal time” it takes to graduate, as determined and reported by the National Center for Education Statistics.
The Weights:
- Student Satisfaction – 16%
- Admission Rate – 16%
- Number of Online Programs – 18%
- Student-to-Faculty Ratio – 16%
- Average Aid Received – 18%
- Graduation Rate – 16%
After calculating a final score for each school, the scores are scaled to 100 against each other to determine the final OSR Score seen next to each school. The numbers displayed for each data point under the school are the actual, unmanipulated data points for each school.
A Final Word
We know the best colleges according to these data points. They are authoritative and heavily researched.
But ultimately you are the final judge.
Consider several programs before you pick a school. Reach out to the staff, professors, and alumni to get a feel for the individual community each school fosters.
OSR is a tool that will help get you where you need to be. The rest is up to you.
Please note: The methodology was updated November 2021.