
Everyone’s college experience is different. But some are better than others.
Here at OSR we focus on online programs, which are just starting to blow up. Some schools have figured out how flexible and innovative online education can be – other schools are still trying to catch up.
So how do we measure an online program’s quality?
You want to get straight to the information – real numbers based on hard data.
Featured Programs
So we stick to statistics. We developed a system to sum up a college’s merit based on six key stats. We pulled those stats from reputable sources, factored them together, and developed our ranking method. If you want to learn more about OSR and the team behind the method, read about us here. If you want to learn more about our methodology, read on!
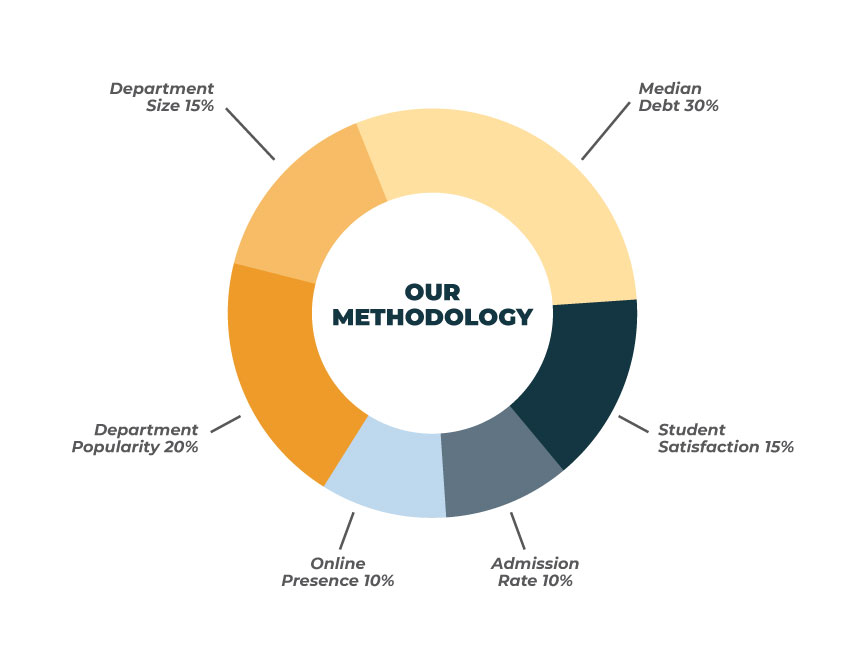
Here’s a breakdown of how we rank programs and where we get our information:
“Best” Rankings
Data Points
School-wide
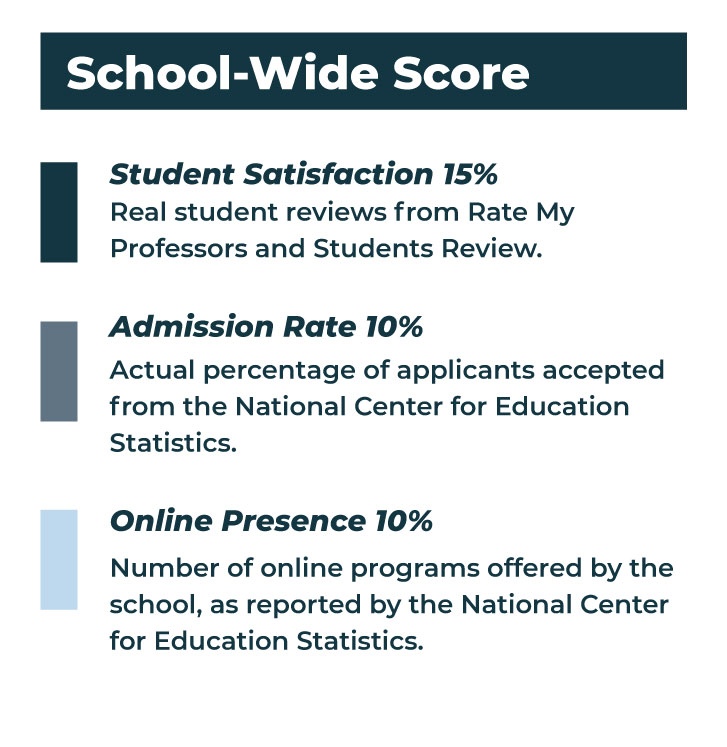
Student Satisfaction
A combined score from RateMyProfessors.com and StudentsReview.com. The number is a score out of 5 with two decimal places.
Admission Rate
The actual percentage of students who applied who then got accepted in the 2021-2022 school year. Reported by the National Center for Education Statistics.
Online Presence
For bachelor’s degree rankings, the number of online bachelor’s programs offered at the university. For master’s degree rankings, the number of online master’s programs offered at the university. Reported by the National Center for Education Statistics.
Program Level
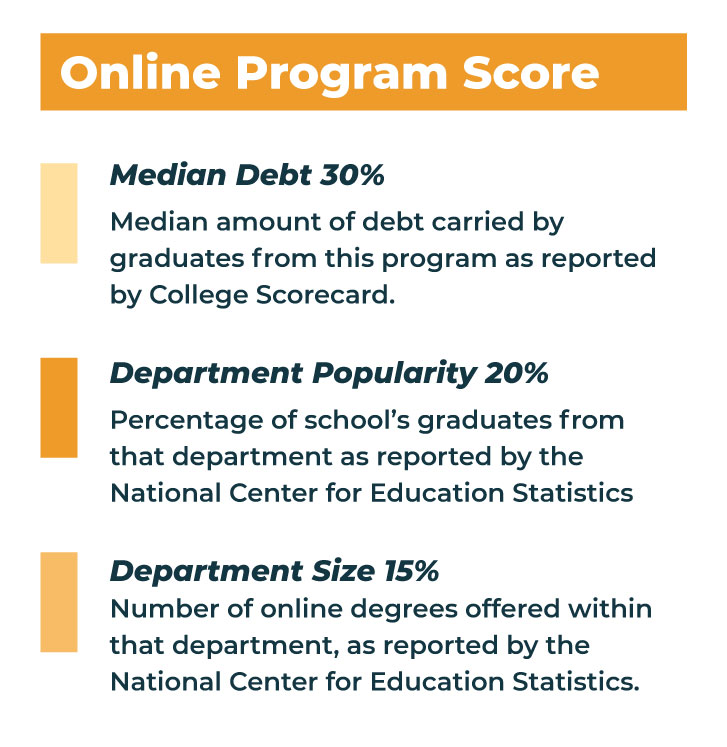
Popularity at School
The percentage of students at that school who graduated with a degree from the ranked program’s department in 2021. Reported by the Department of Education’s College Scorecard.
Department Size
The number of online degrees offered within the ranked program’s department. Reported by the National Center for Education Statistics.
Median Debt by Program
The average debt for students who graduated with that degree at that school. Reported in College Scorecard’s “Preliminary Loan Debt Data by Field of Study.”
Process
All schools that offered the degree in question online in 2021-2022 are considered. The six data points above are pulled for all schools on that list. Each data point is then scaled to 100 against the other schools on the list. From there, the weights are added and combined into the OSR score.
The weights:
Student Satisfaction – 15%
Admission Rate – 10%
Online Presence – 10%
Popularity at School – 20%
Department Size – 15%
Median Debt by Program – 30%
After calculating a final score for each school, the scores are scaled to 100 against each other to determine the final OSR Score seen next to each school. The numbers displayed for each data point under the school are the actual, unmanipulated data points for each school.
Missing Data
For data points that were not reported or “Privacy Suppressed,” a penalized number was substituted during scoring. The ranking will still display “not reported” next to the data point.
For Student Satisfaction, Admission Rate, and Popularity within School, the average for all schools penalized by 15 percent is used.
For Online Presence and Department Size, the school is given a score of 1.
For Median Debt, the process is different for bachelor’s and master’s programs: for undergraduate programs, it’s the average debt of graduates at the whole university; for graduate programs, it’s the average debt of graduate students from all programs at all US schools, penalized by 15 percent.
Return on Investment
Return on Investment represents how much more a high school graduate would earn in 20 years if he or she went to that university rather than not attending college at all.
To calculate ROI for each school we start with the median earnings of graduates 10 years after finishing school, according to the Department of Education’s College Scorecard. We extrapolate their cumulative earnings 20 years after graduation, assuming they got a 2 percent raise every year starting right out of college. We subtract the Net Price of a degree from that school. We then calculate the difference between those cumulative earnings and the cumulative earnings of an average high school graduate 24 years after graduation. This assumes that students earn nothing during their four years of school but do receive financial aid.
ROI has no effect on the final OSR score or a school’s position in a ranking.
“Most Affordable” Rankings
Most Affordable rankings sort schools solely on their Average Net Price, as reported by the National Center for Education Statistics in 2018. Average Net Price factors in expected financial aid and fees.
All the above data points are included to provide context, but none contribute to the final ranking.
“School-wide” Rankings
Rankings that don’t focus on a single program, like Best ROI or Best Online Colleges rankings, use different metrics.
Student Satisfaction, Admission Rate, and Online Presence are the same as the program-specific rankings. In addition we use Student-to-Faculty Ratio, Average Financial Aid, and Graduation Rate.
Student-to-Faculty Ratio
The average number of students per one faculty member, as reported by the National Center for Education Statistics.
Average Financial Aid
The average award given to each student, as reported by the National Center for Education Statistics.
Graduation Rate
The percent of full-time undergraduate students who enroll and subsequently graduate within 150% of the “normal time” it takes to graduate, as determined and reported by the National Center for Education Statistics.
The weights:
Student Satisfaction – 16%
Admission Rate – 16%
Online Presence – 18%
Student-to-Faculty Ratio – 16%
Average Aid Received – 18%
Graduation Rate – 16%
After calculating a final score for each school, the scores are scaled to 100 against each other to determine the final OSR Score seen next to each school. The numbers displayed for each data point under the school are the actual, unmanipulated data points for each school.
A final word
We know the best colleges according to these six data points. They are authoritative and heavily researched.
But ultimately you are the final judge.
Consider several programs before you pick a school. Reach out to the staff, professors, and alumni to get a feel for the individual community each school fosters.
OSR is a tool that will help get you where you need to be. The rest is up to you.